How to Make a Graph in Google Docs?
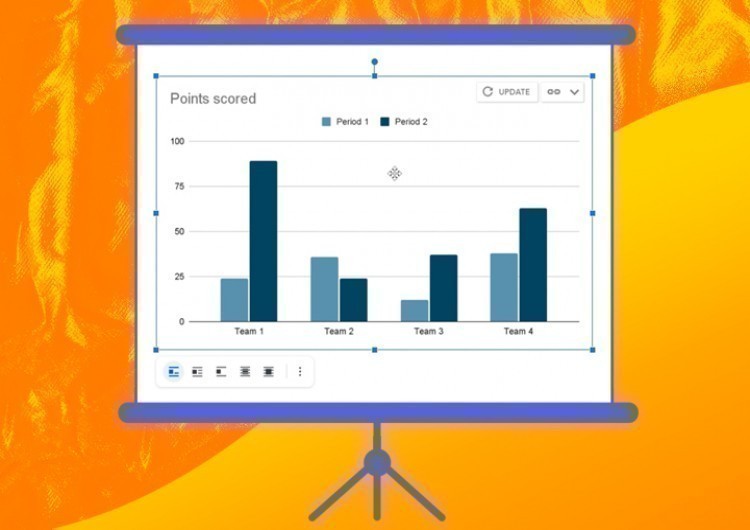
It’s nice to have a wide selection of tools to present data the way you want. Graphs in Google Docs, luckily, can be mostly called simple compared with other tools. They can be really advanced, but keep in mind that in this tutorial, we will cover narrowly the basics of working with graphs in Google Docs, allowing you to create simple charts and not really focusing on the advanced functionality.
Watch the video from https://thegoodocs.com/ and learn How to make a graph in Google Docs:
Inserting a Graph
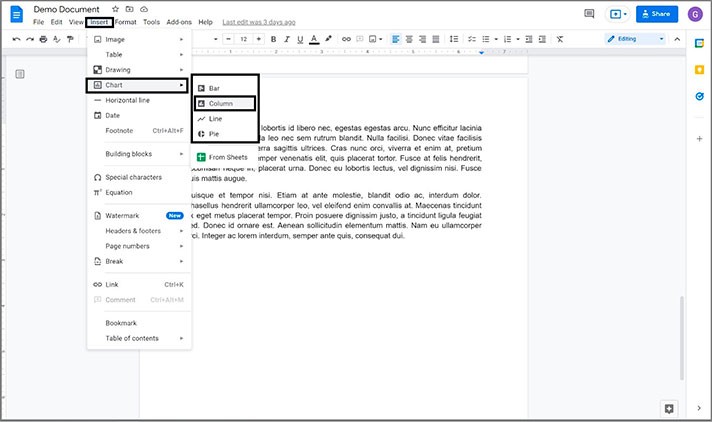
- To start, in the document, put the mouse cursor where you want your chart to appear. Then we go to the Insert button on the top toolbar dragging the mouse pointer down to the Chart item. And in the new menu, among these 4, select the one you like to start from. We’ll make the Column graph as an example
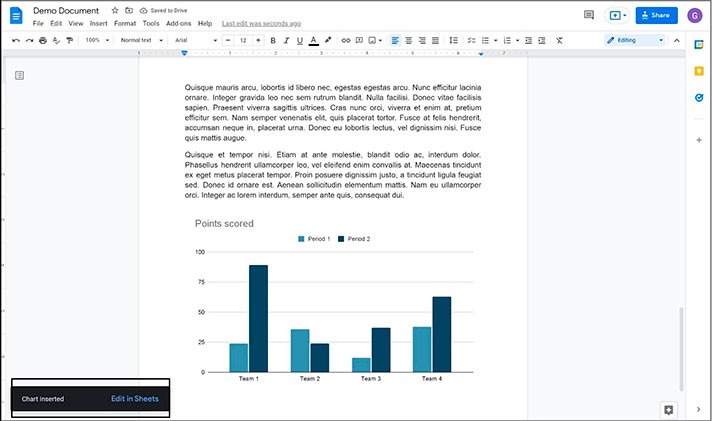
- Waiting a bit, and here you have it in your Google Doc, with the notification on the bottom left suggesting to edit it in the Google Sheets
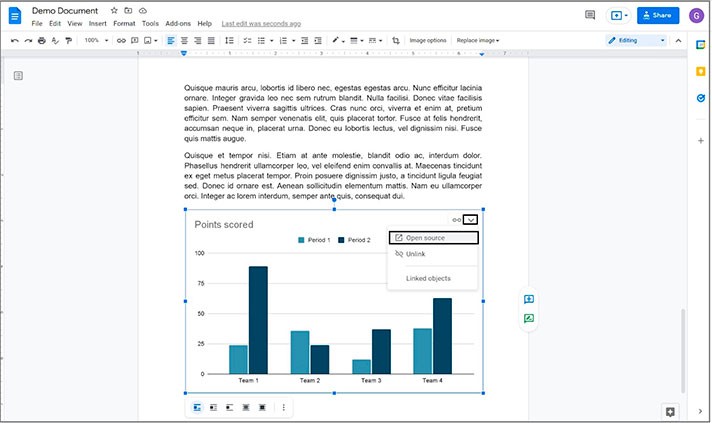
- Since working with charts in Google Docs is actually realized through Google Sheets with all the controls there. And that’s what we are heading for. So, press on your graph, go to its top-right corner, click on this little arrow symbol, and press the Open source item
Editing a Graph in Google Sheets
- Now we are on the new Google Sheets document created specifically for editing this chart
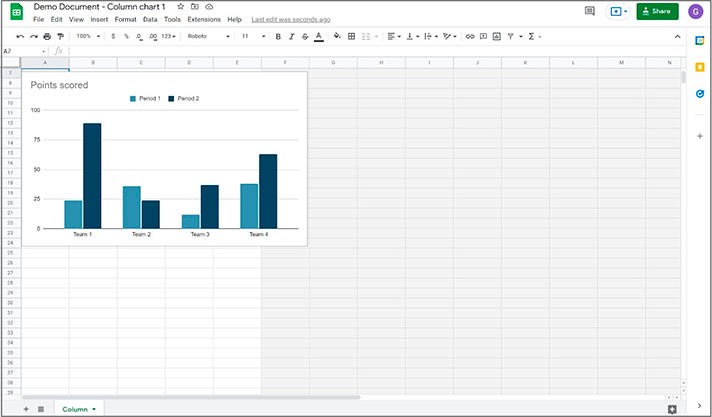
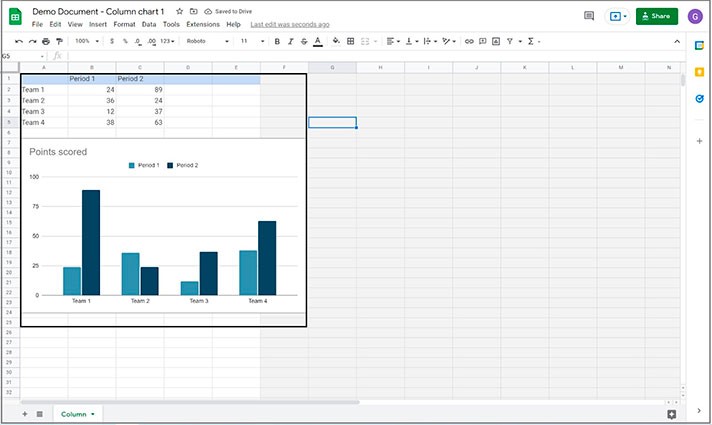
- Let’s scroll up to locate the values in this graph, and here they are, which correspond to values in the graph itself
- Meaning that by modifying these values, the data on the chart is updated respectively; let us show you how that works. For instance, Team 3 has the lowest score in the first period, just twelve. And let’s increase that to ninety and apply
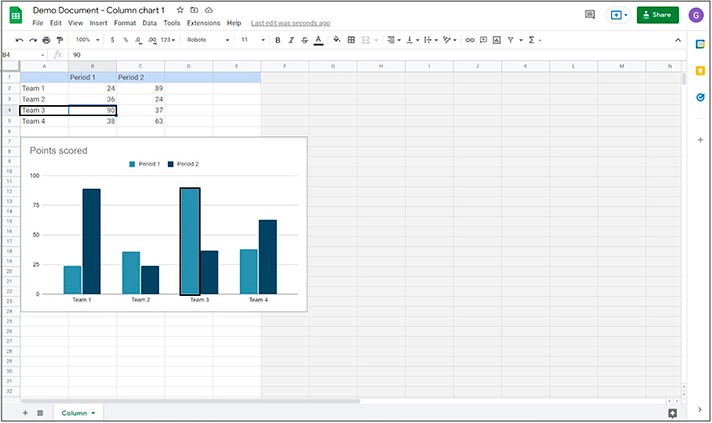
- As you just saw, the bar in Period 1 for Team 3 instantly increased in height, reaching the level of Team 1. And basically, this is how the whole thing works
Customization of the Chart
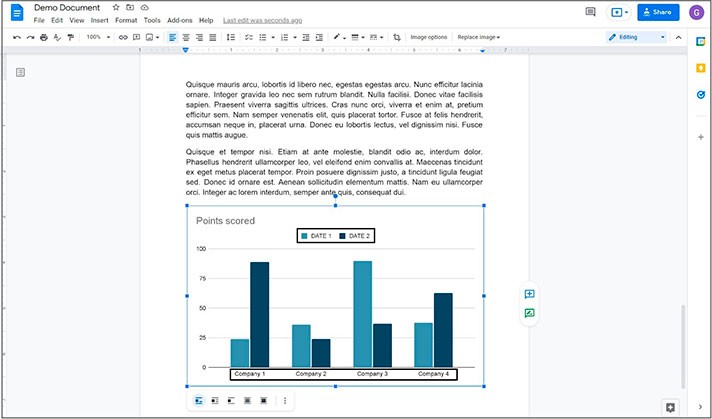
- But that’s only the beginning. For instance, you can change the name of the columns, which will make it change in the graph. So as the rows. As a sample, we are going to change the names in the columns and in the rows. And everything works
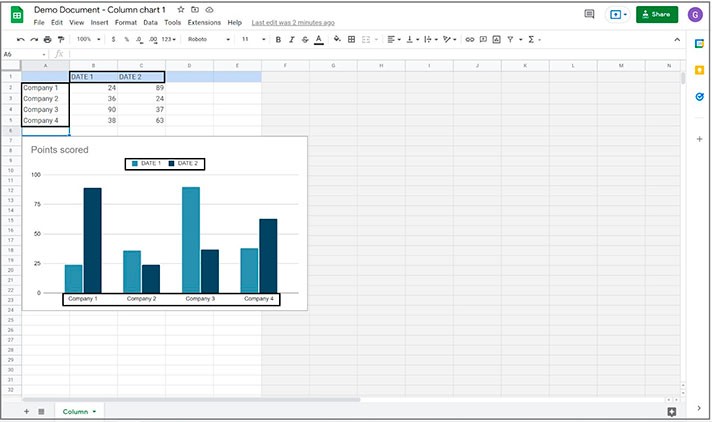
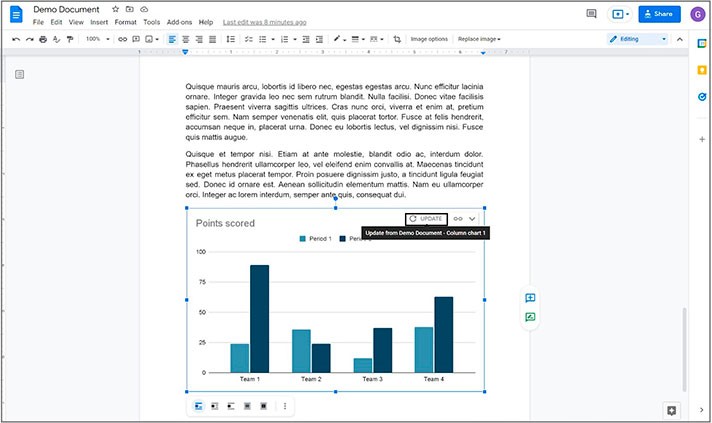
- And that’s enough to make a simple chart. We just selected the graph form that we liked and then modified the values. Let us show you that in the document. As you can see, the graph remained the same. And here, it’s just like with the website pages when you need to update the page to see new changes. So, we just press the Update button in the top right corner of the chart, and there you go — the new values
Advanced Features
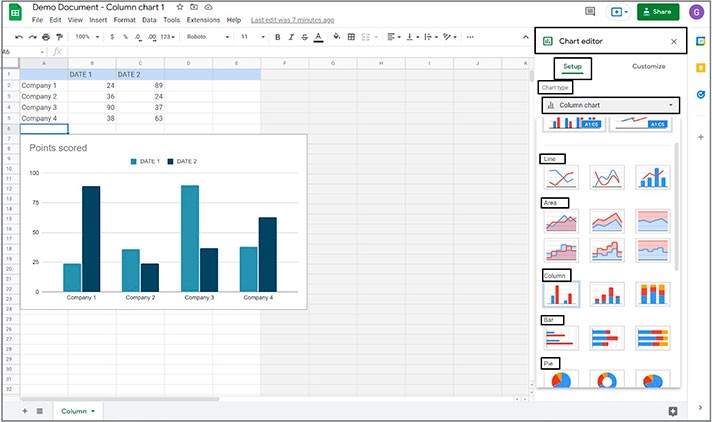
- What goes next is the real customization. We are again in Google Sheets. Press twice on the graph. This is really nice, starting from the Chart style. So, let’s press the field, and here you have quite a lot of options. The Pie with percent values, the bar, the line chart, and you got it. There’s a lot to choose from
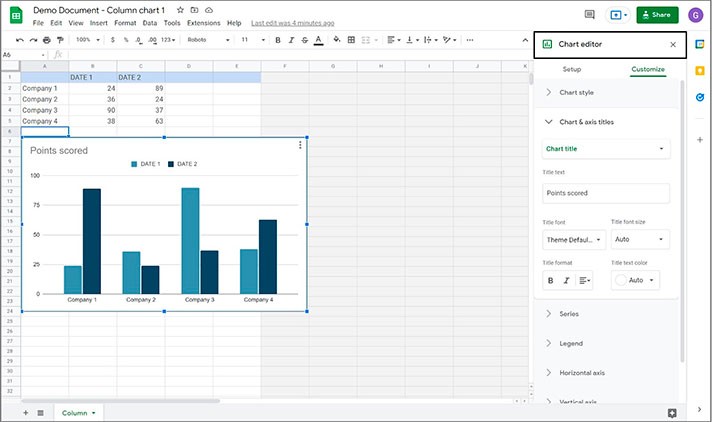
- This field stands for how many columns are in use
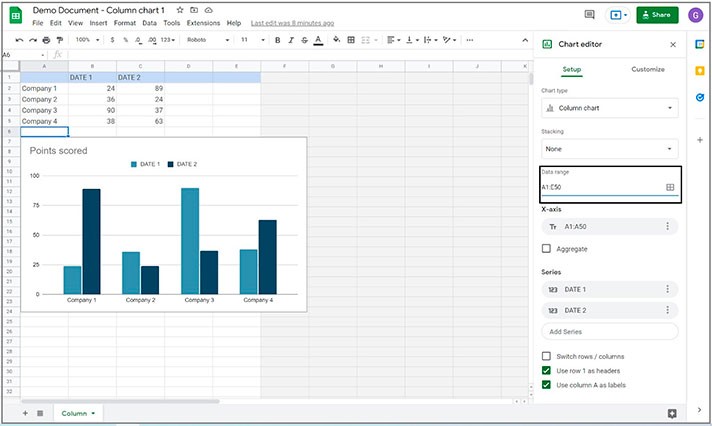
- And the next one is how many rows are in use
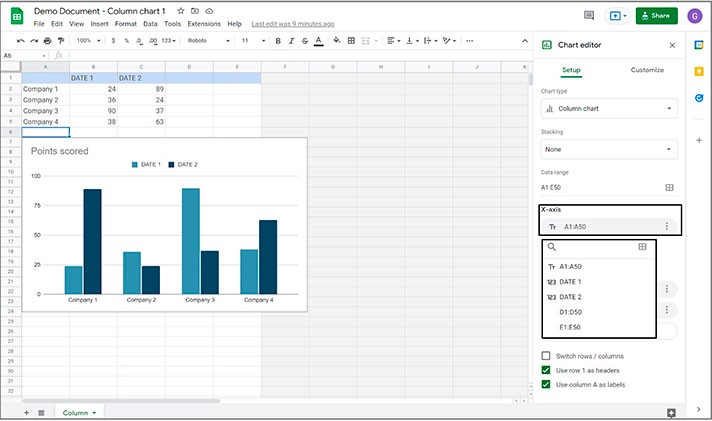
Adding More Values
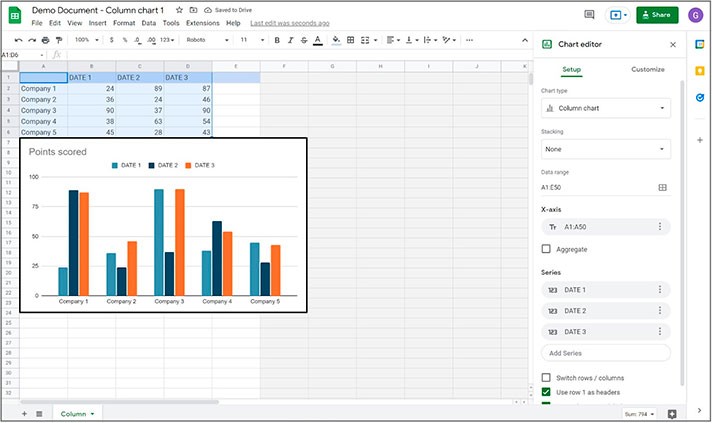
- This means that we can make it A1 to D5, and now it will cover a bigger area: A1 — D6. That will allow us to create one more team — Team 5, and set the number of points for them. But as you can see, it didn’t do a thing. Because we have to indicate that we’ve created one more bar. So, we go back to its settings, go down to the Series options, and in the Add Series field, we select DATE 3. There you go
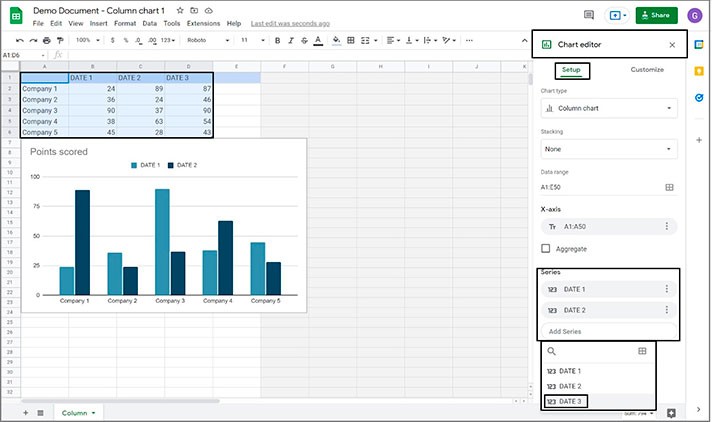
- The data on the graph is updated with the relevant data. And that’s how you do it
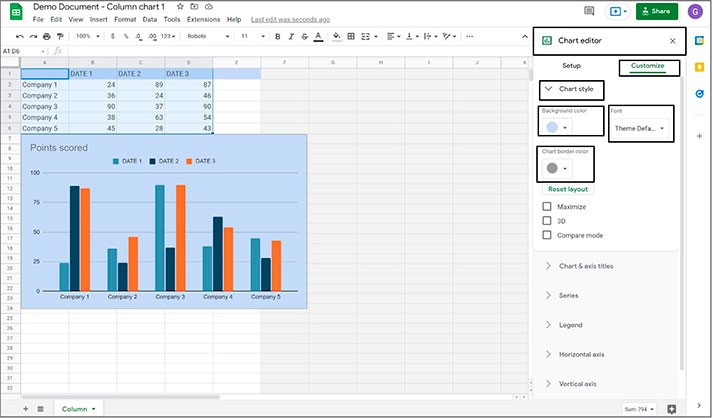
- But then comes the advanced customization on the next page of the chart editor. But that’s more about the looks. Let us go through a few random ones just to demonstrate. And this makes it. Use it for your own good
We hope this brief tutorial will help you learn how to make a graph in Google Docs. Good luck!

We are a team of creative people who dream of sharing knowledge and making your work and study easier. Our team of professional designers prepares unique free templates. We create handy template descriptions for you to help you choose the most suitable one. On our blog, you'll find step-by-step tutorials on how to use Google Products. And our YouTube channel will show you all the ins and outs of Google products with examples.


