Get Free Chart Google Sheets Templates
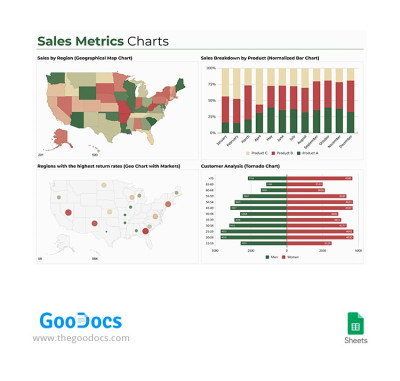
Sales Metrics Charts
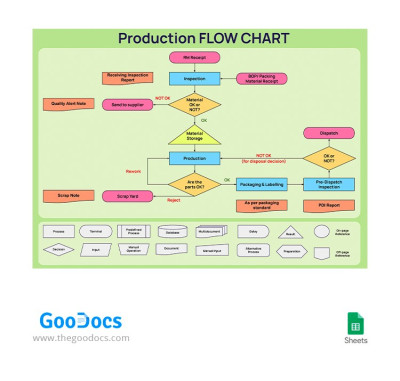
Production Flow Chart
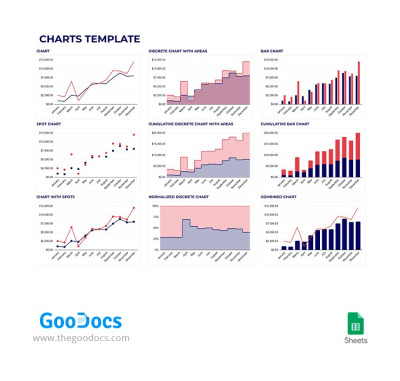
Blue & Red Charts
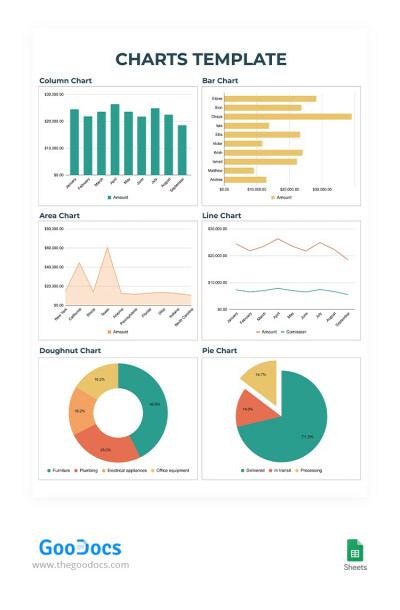
Colorful Charts
What is a chart and who needs to work with this type of visual data?
The answer is easy – anyone who is working with digits and money, including budgeting, project management, export/import calculations, and many more. Charts help to present data in a clear and concise manner, making it easier to identify patterns, trends, and relationships between different variables. Whether it is a line graph, bar chart, or pie chart, visual representations provide a quick overview of complex data sets and enable decision-makers to make informed choices.
In case you want to simplify your job, welcome to use premade chart templates!
Why Do Many People Prefer Premade Charts Templates?
Many users may not realize the potential benefits of utilizing chart templates in Google Sheets, thus, let’s explore some of them below.
Time-Saving – Let Your Head Rest!
Utilizing chart templates in Google Sheets can save users a significant amount of time. Instead of spending time selecting chart types, adjusting colors, and formatting axes, users can simply choose a template that best suits their data and instantly apply it.
Free of Charge – Save Your Wallet!
Google Sheets' chart templates are free of charge. With easy access to website resources, users can access and utilize a wide range of chart templates without any additional costs. This makes it an ideal tool for those working on a tight budget or for educational purposes.
Wide Variety of Designs
In addition to being free, chart templates in Google Sheets offer a wide variety of options to suit different data visualizations. Whether it's a simple bar chart, a complex scatter plot, or a detailed financial report, Google Sheets provides numerous templates that cater to diverse needs.
Highly Editable
While templates offer a great way to create charts quickly, they can be further modified to suit individual preferences. Users can easily tweak aspects such as axis labels, titles, and data series, allowing for personalized charts that accurately represent their data. This flexibility empowers users to present their data in a way that best communicates their message.
Exploring TheGoodocs for Free Templates
If you like the idea and already think of a project that might need visualization, you are welcome to discover free resources from Thegoodocs.com. Free chart templates in Google Sheets from TheGoodocs offer a wide range of options and styles, allowing users to create visually stunning and informative charts in just a few clicks. Whether you need to create a bar chart to compare sales data or a pie chart to show the breakdown of expenses, the website has got you covered.
Simply use the search bar or category filters to find a necessary template. For instance, if you are looking for a Gantt chart in Google Sheets, type in the request and get the possible variations. Choose the one you think is appropriate and click the Edit Template button.
All templates are created by a professional team of designers, printable, and showcase world practices.
Customizing a Chart Template: Easy as Never Before
Customization of chart templates in Google Sheets allows users to create visually appealing and informative charts for their data.
One of the key benefits of customizing chart templates in Sheets is the ability to personalize the appearance of the chart. Users can adjust colors, fonts, and backgrounds to match their branding or design preferences. This helps to create a consistent and visually appealing look across all charts in a presentation or report.
In addition to appearance, customization of chart templates allows users to control the layout and organization of the chart. They can change the position and size of the chart, as well as adjust the placement of the axis labels and title.
Don’t doubt anymore, and try it out for free!)


