Visualize Your Data: 25 Free Google Sheet Templates for Charts and Graphs
- Why Should You Use Templates for Data Visualization?
- Free Templates Collection for Any Business!
- Pareto Chart
- College Budget with Charts
- Personal Finance Spreadsheet
- Event Planner Budget
- Event Planning Estimate
- Expense Tracker with Charts
- Clustered Column Chart
- Dark Blue Sales Dashboard
- Burndown Chart
- Brown Gradebook
- Combination Chart
- Convenient Blood Pressure Tracker
- Light Weekly Budget
- Annual Marketing Budget with Charts
- Quality Control Chart
- Annual Marketing Budget
- Agile Burndown Chart
- Dark Annual Budget
- Cycle Time Scatterplot Chart
- One Page Project Management
- Combo Chart Template
- Project Management Cash Flow
- Campaign Budget
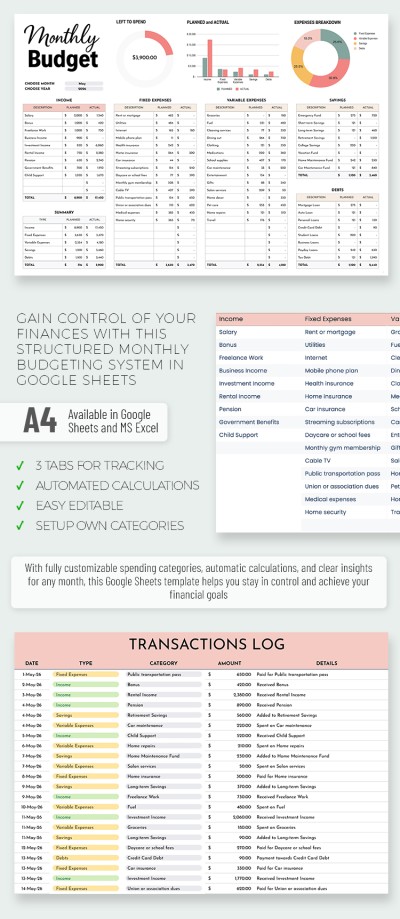
- Easy Monthly Budget
- Free Budget Template With Charts
Some of you may doubt the necessity of using spreadsheets at work or even at home, but there is a great BUT: Believe U need a Template! Dealing with figures requires huge efforts during working hours and spending overnight becomes a habit. Not everyone is ready for this, but when the job requires, we do struggle with work-life balance.
Thankfully, premade spreadsheets can provide a well-designed structure with built-in charts that automatically show your data visualization. All you need is to adjust figures, remove unnecessary rows or add more data columns.
Cool? Then take a cup of coffee and read next! ☕
Why Should You Use Templates for Data Visualization?
Data visualization is a crucial tool in any industry, as it allows for the effective communication of complex information in a visually appealing manner. Project management, financial department, construction industry, and many more…That’s all about you guys!))
To create impressive visualizations, it is essential to use templates in Sheet for data visualization. Templates offer numerous benefits and can significantly enhance the efficiency and accuracy of the visualization process.
- Consistency throughout the project? YES.
- Time-saving aspect? Absolutely YES.
- Collaboration mode? Two-times YES.
- High customization and eye-catching visuals? Strong YES!
We are not going to count all benefits, as you can try it out and share your experiences with more people!
Free Templates Collection for Any Business!
Now when it’s all said and done (we mean you already dripping a tasty coffee!), let’s explore this remarkable business-like collection of free chart & graphs templates including:
- Budgets;
- Expense Sheets;
- Finance Trackers;
- Sale Dashboards;
- Project Management Planners.
and even a chart to control your blood pressure – it does exist!)) 👀
Pareto Chart
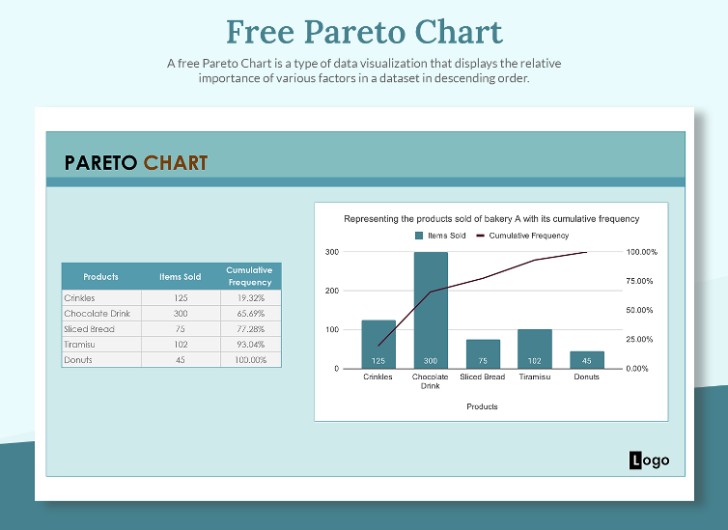
Are you working with a wide product row and have to detect new opportunities? The Pareto chart, also known as the 80/20 rule, suggests that 80% of the effects come from 20% of the causes. By using this premade chart with a simple table, you can focus efforts on the most significant issues to achieve maximum results.
College Budget with Charts
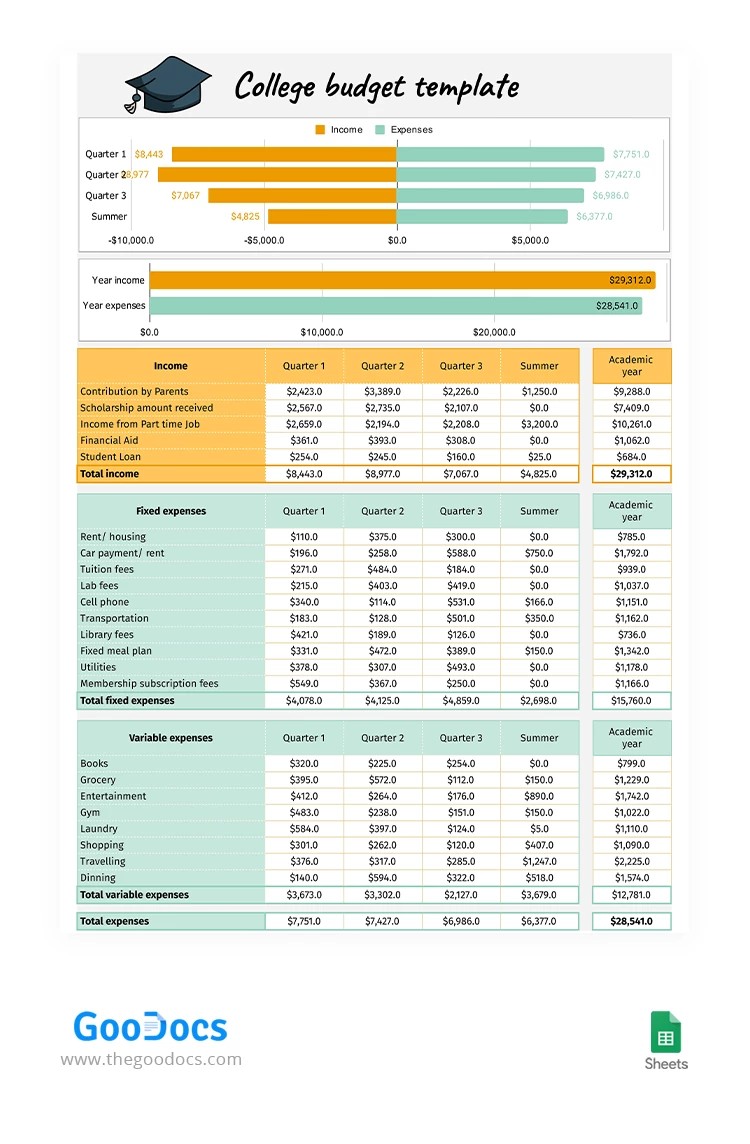
This free premade college budget template with an income/expenses chart can be a valuable tool for any college student. This type of template provides a clear and organized way to keep track of income sources, such as financial aid, part-time jobs, or parental support, as well as expenses like tuition, books, housing, and food. Easily edit it and print it out in high quality!
Personal Finance Spreadsheet
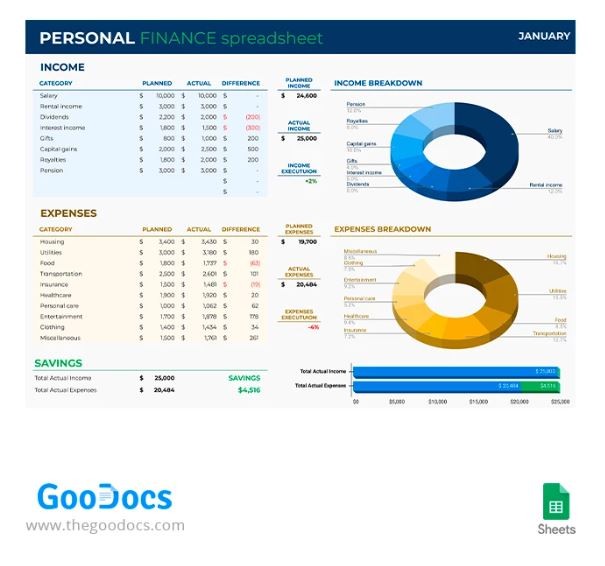
Don’t know how to control your household and personal finances? Then this template is for you! This budget template in a nice green theme and savings chart is an excellent option for individuals and families to manage their finances effectively. Save it for free and share it with your family to collaborate on financial decisions.
Event Planner Budget
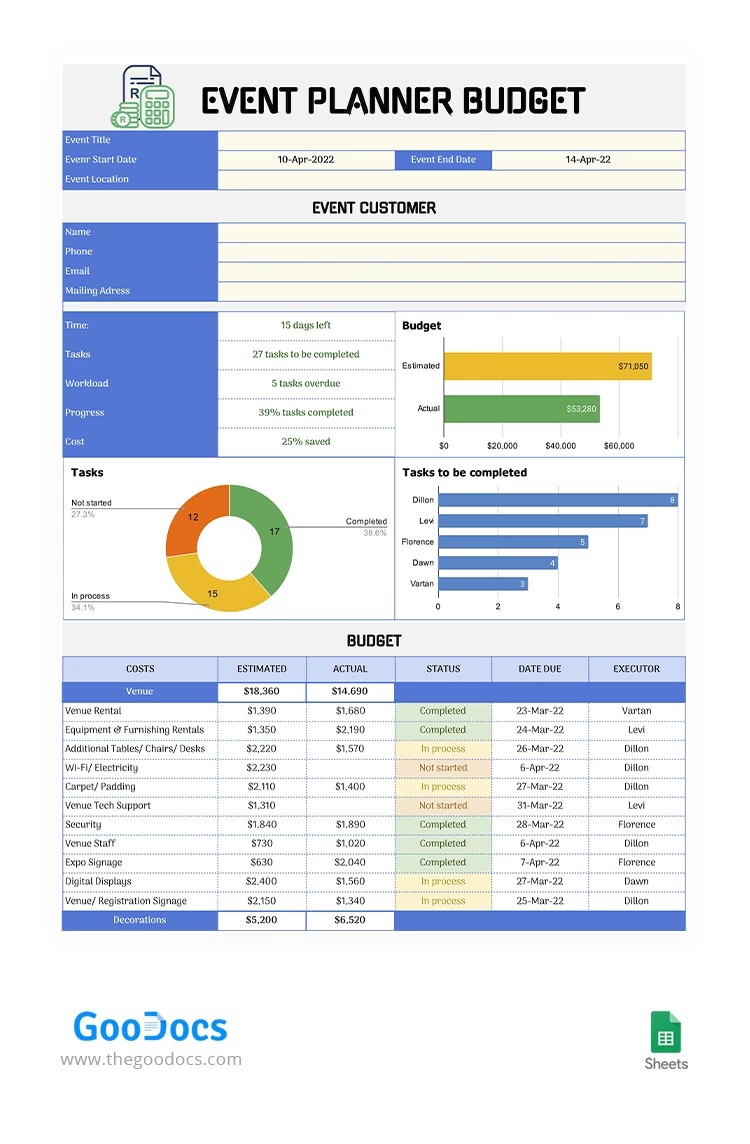
Try out this event planner template that consists of valuable charts and a budget table. It is easy to use and customize according to the event requirements. You will be pleasantly surprised by how it can be effective to use visual data and not overspend money. Try it out!
Event Planning Estimate
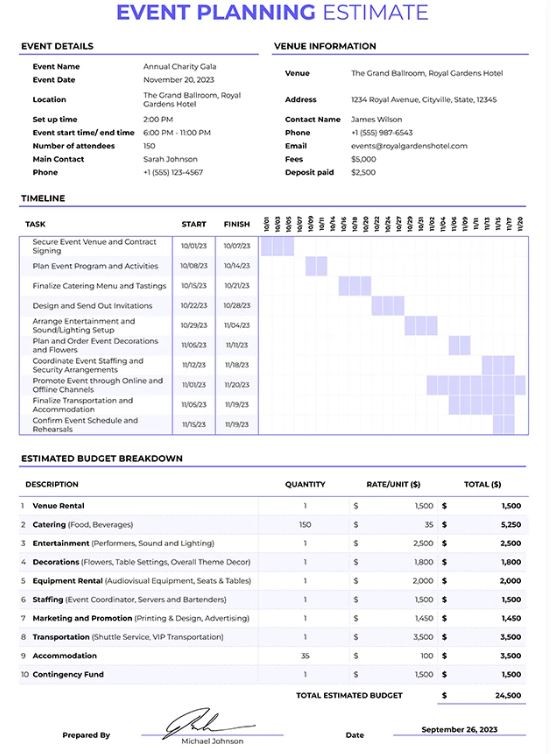
Can’t wait to arrange an event, but feel troubled about proper budgeting? Don’t worry! This event budget template with a summary chart provides a comprehensive overview of all the financial aspects associated with an event, saving time and effort by eliminating the need to create a budget from scratch. Add your data and efficiently allocate the resources.
Expense Tracker with Charts
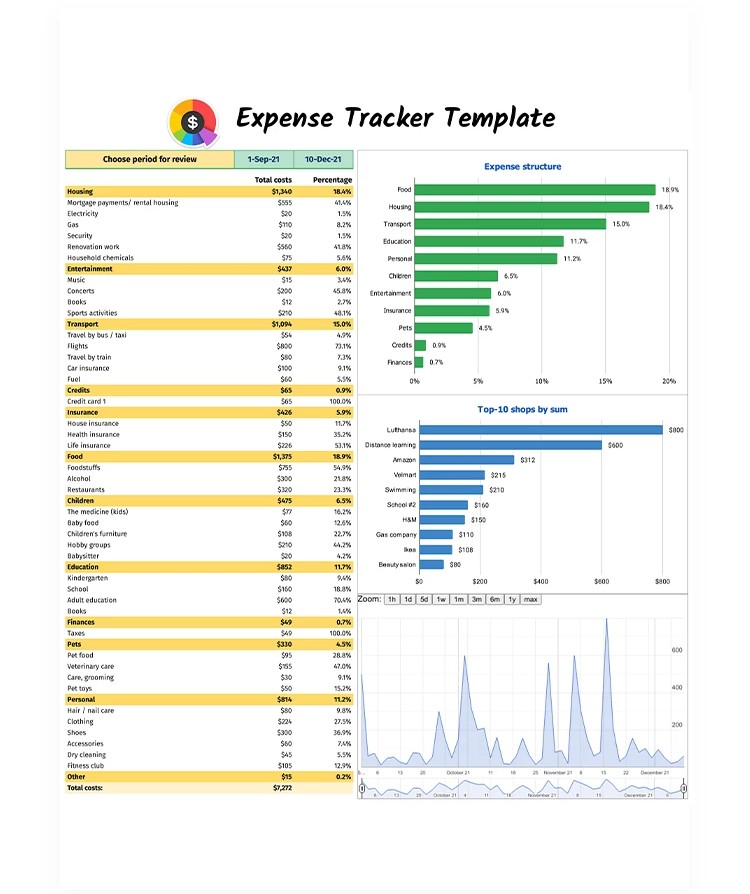
An expense tracker template on two pages with a table and chart is a valuable tool for individuals and businesses to monitor finances effectively. The first page consists of a table where one can input different expense categories, while the second page contains different charts. Save it for free to Google Drive and use it from any device.
Clustered Column Chart
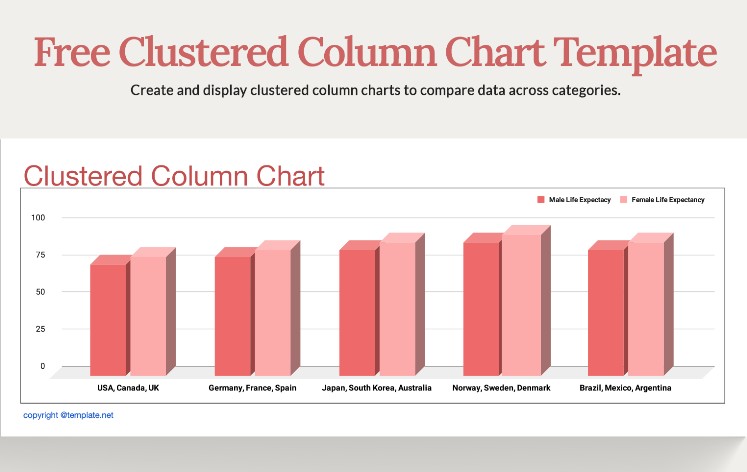
With this premade template you can easily create a clustered column chart comparing different data within different brands, courtiers, producers, or whatever you need. You can customize it in with the help of Google Sheet’s menu and toolbar and visualize the data in the desired way.
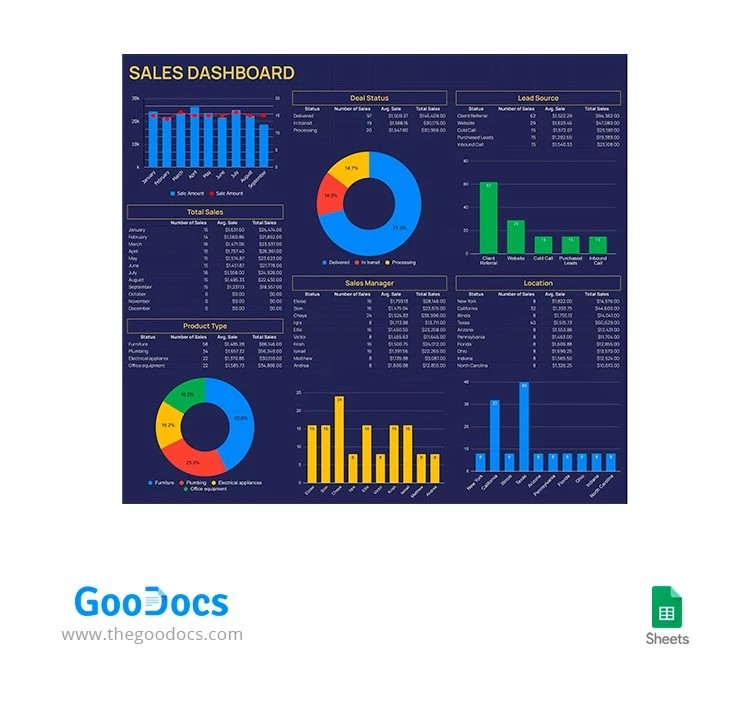
Dark Blue Sales Dashboard
OMG! This template is nothing, but a big valuable dashboard to keep all necessary information on one sheet! It consists of six different charts and can be used to collaborate with colleagues or partners via Google Drive. Get ready to visualize your data and maximize effectiveness.
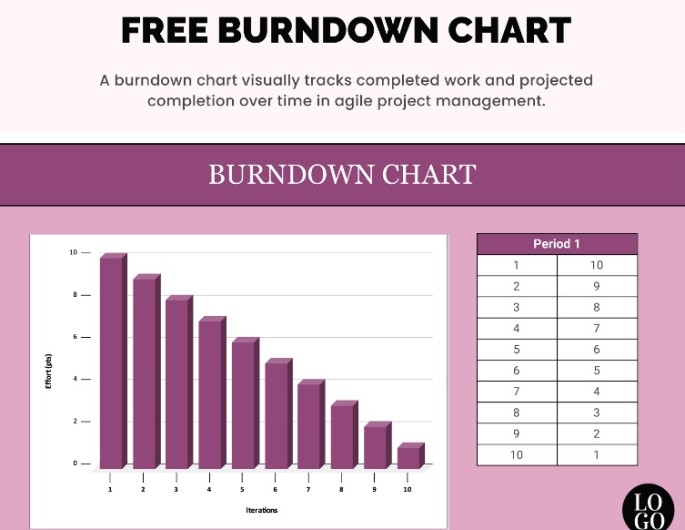
Burndown Chart
This free editable burndown chart template is used to track the completion of work in a project. This visual representation helps the team to monitor their progress and identify any deviations from the planned schedule. The chart shows the total amount of work that needs to be completed and the remaining work over time. Try it out!
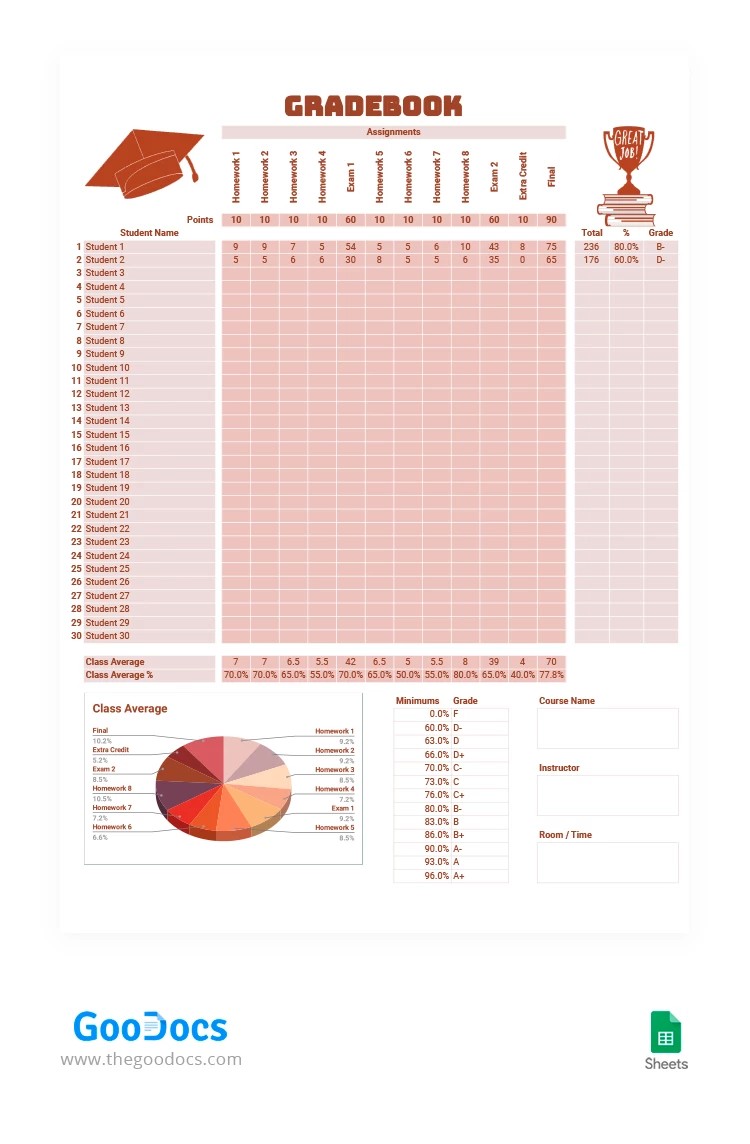
Brown Gradebook
This is something new and remarkable! Yes, it’s a table with a grade chart to track students’ assignments and exams. If you are a teacher and don’t have time to create a monitoring sheet on your own, this one will be a valuable resource to visualize studying progress. Take some time to edit data and track the result!
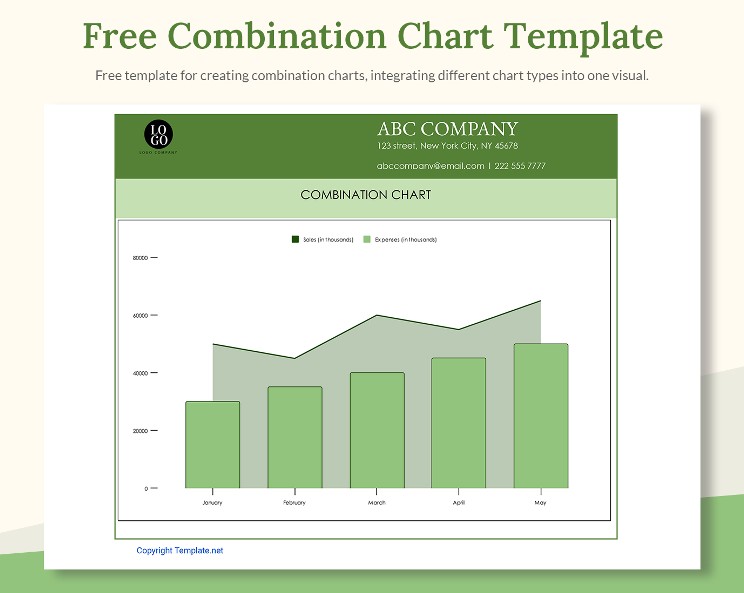
Combination Chart
Look at this premade chart that integrates several visual charts into one! This template can be used in various fields, such as business, finance, education, or project management, to showcase the integration of different elements or components. Moreover, the green theme gives the chart a refreshing and vibrant look, making it visually appealing and easy to read.
Convenient Blood Pressure Tracker
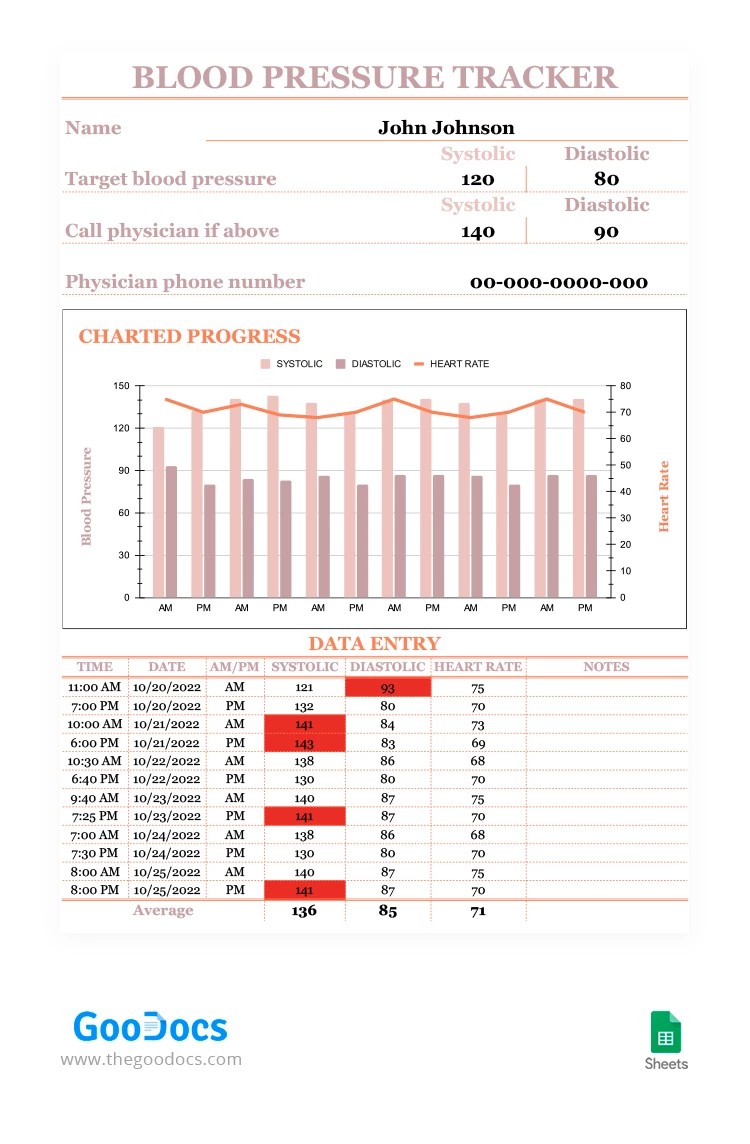
High blood pressure, or hypertension, is a common health issue that can lead to serious complications if left uncontrolled. By tracking blood pressure consistently, you can identify patterns, make lifestyle changes, and work more confidently! This template is created exactly for this purpose and consists of a data entry table and a chart. Stay healthy!)
Light Weekly Budget
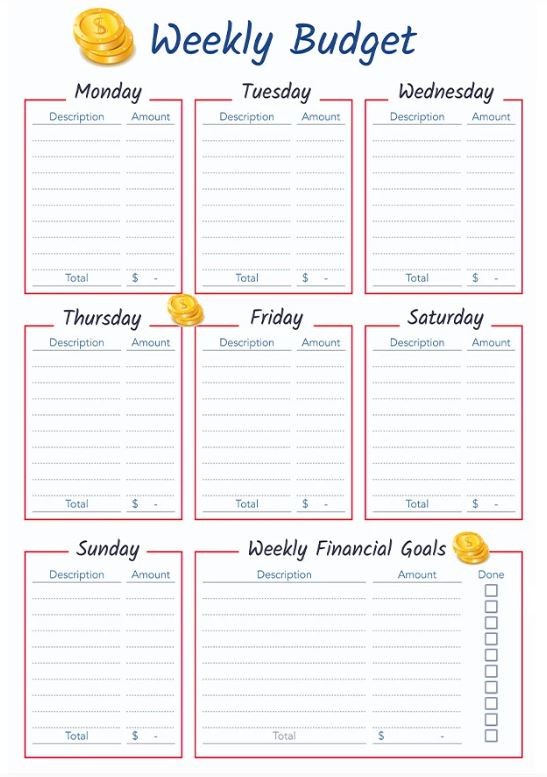
Always dreamt to manage your finances like a PRO? We recommend you use premade budgeting templates like this one. The template not only consists of data entry tables but allows visualizing the total weekly budget. Save this template for free and edit it in Google Sheets. You may also print it out and hang it on the visual board.
Annual Marketing Budget with Charts
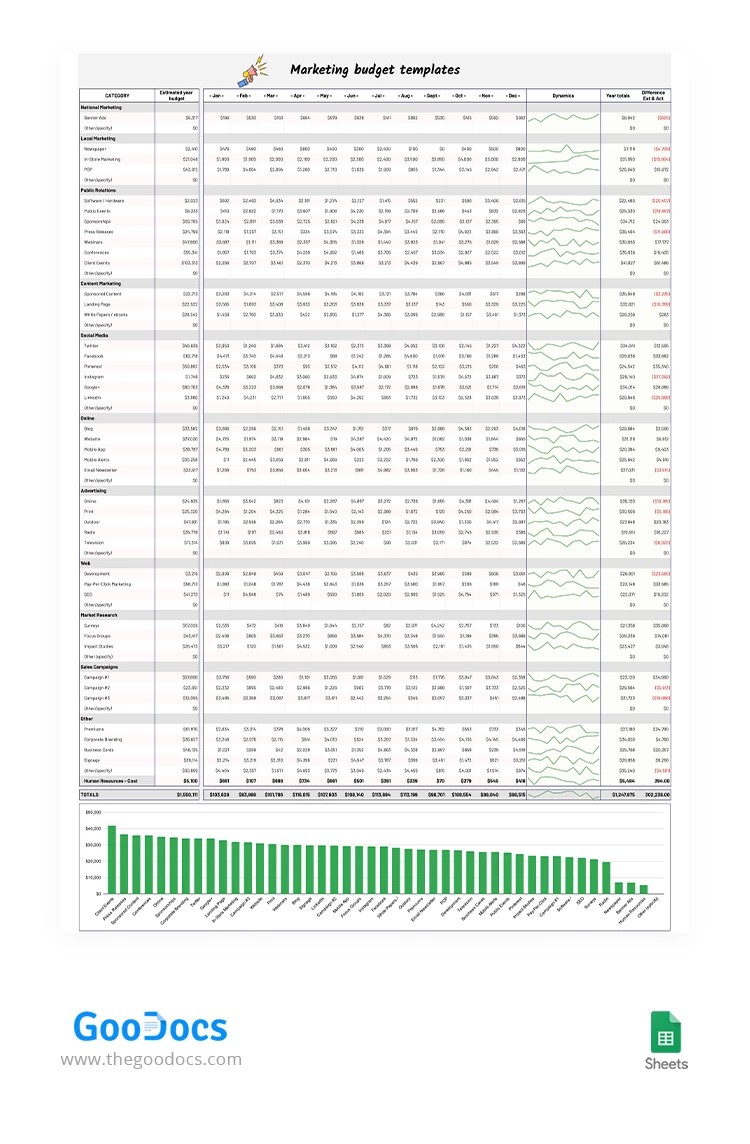
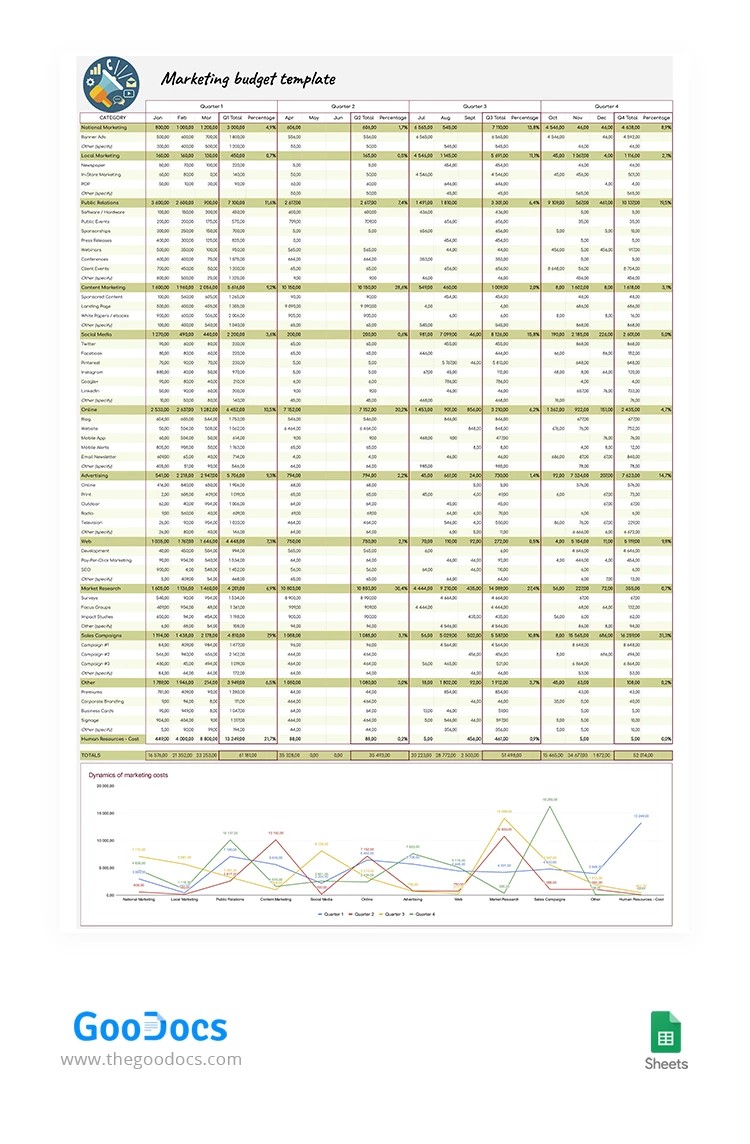
Use this premade marketing budget template to plan and allocate resources effectively, ensuring that the marketing goals are achieved within the available budget. And one useful way to present the annual marketing budget is by using a chart within the template. Try it out!
Quality Control Chart
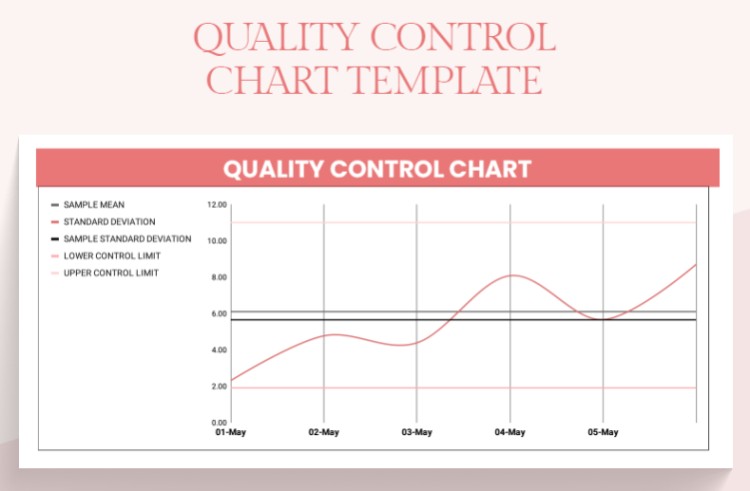
Quality control charts are effective tools used to track and monitor the performance of a process over time. You are welcome to save this free editable template to ensure your business’s high-quality statistics. Edit it according to the current task and customize the chart’s visual part. Level up your control plan and get the maximum effect!
Annual Marketing Budget
An annual marketing budget template with a graph is an essential tool for businesses to effectively plan and track their marketing expenses. This template provides a structured framework for businesses to allocate funds to various marketing activities such as advertising, promotions, events, and digital marketing campaigns. Save it for free and share it with a team to collaborate within Google Sheets.
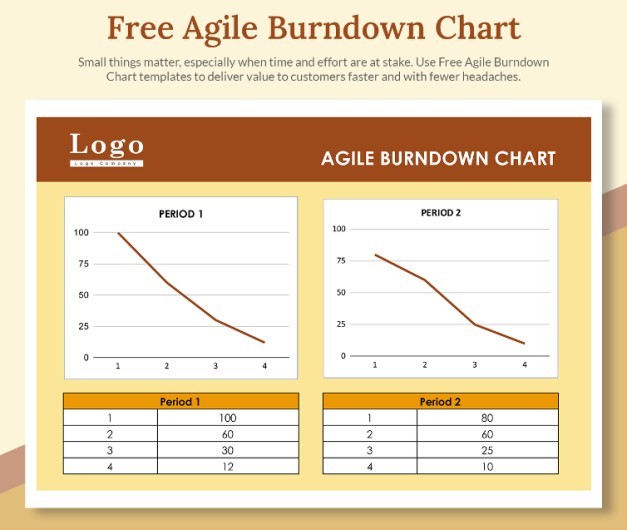
Agile Burndown Chart
This editable burndown chart template is a powerful tool to use in project management to track the progress of work completed in Agile projects. You can gain a clear understanding of project progress and share it with colleagues and the CEO in the digital or paper version. In projects, even small details matter!
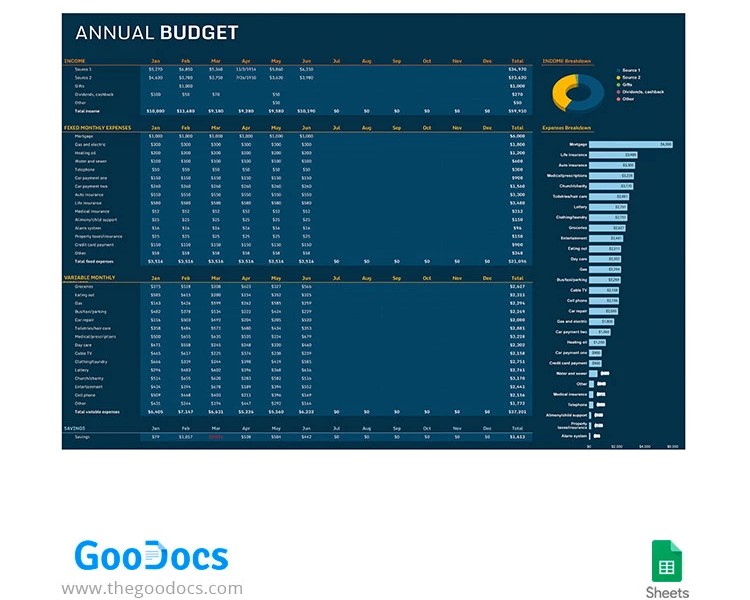
Dark Annual Budget
This free editable annual budget template with charts in dark blue sophisticated color can greatly simplify the process of creating and managing budgets. With its professional design, this template not only provides easy-to-read charts but also ensures that all necessary information is captured in an organized manner. Don’t simply do your job, enjoy the process as well!)
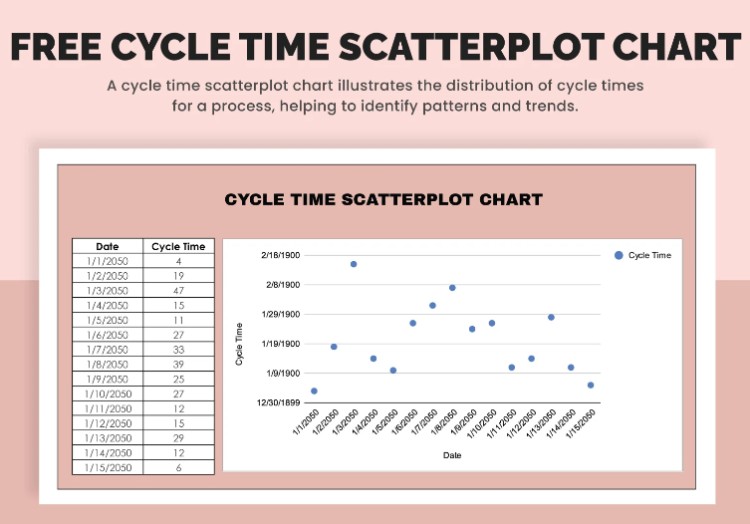
Cycle Time Scatterplot Chart
Cycle time refers to the amount of time it takes to complete a task or process from start to finish. Thus, by using this scatterplot chart, you can easily see the variability and distribution of cycle times over time. This can provide valuable insights into the efficiency and effectiveness of a process. Edit the data table and visualize the result.
One Page Project Management
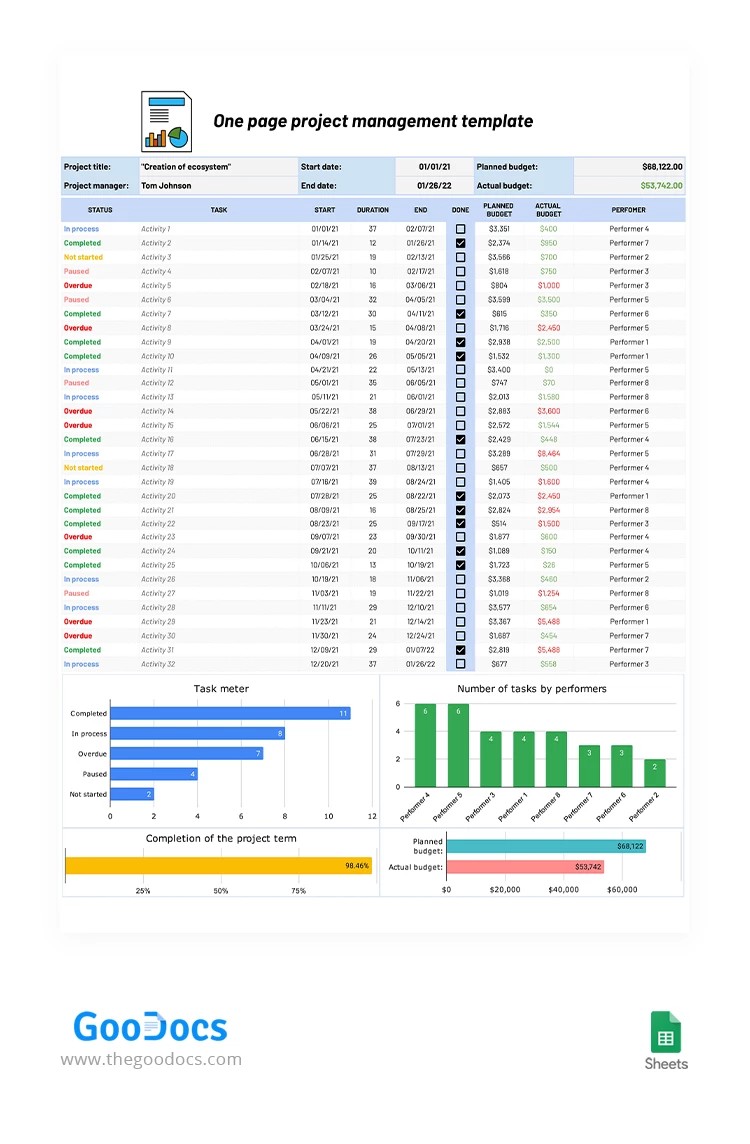
Working as a project manager and running head over heels?) We are here to save you from a huge monotonous job with this free project management template! This template is suitable for effectively tracking and managing project timelines, moreover, it includes two task meter charts to see the data in a visual scheme! Give it a try!
Combo Chart Template
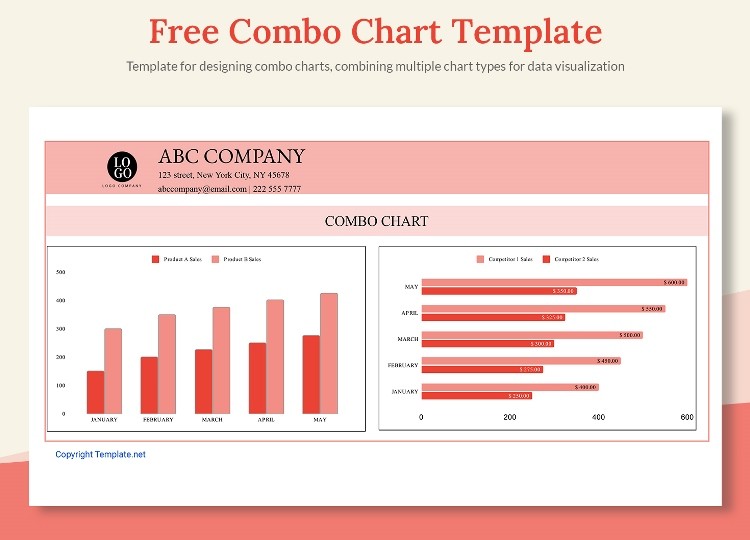
A combo chart template is a powerful tool for visualizing data using different chart types. This template allows the user to combine two or more chart types, such as line charts, bar charts, and scatter plots, into a single graph. You can easily rearrange the chart type in Sheets and customize its visual part. Grab this free chance and experiment with new work methods!
Project Management Cash Flow
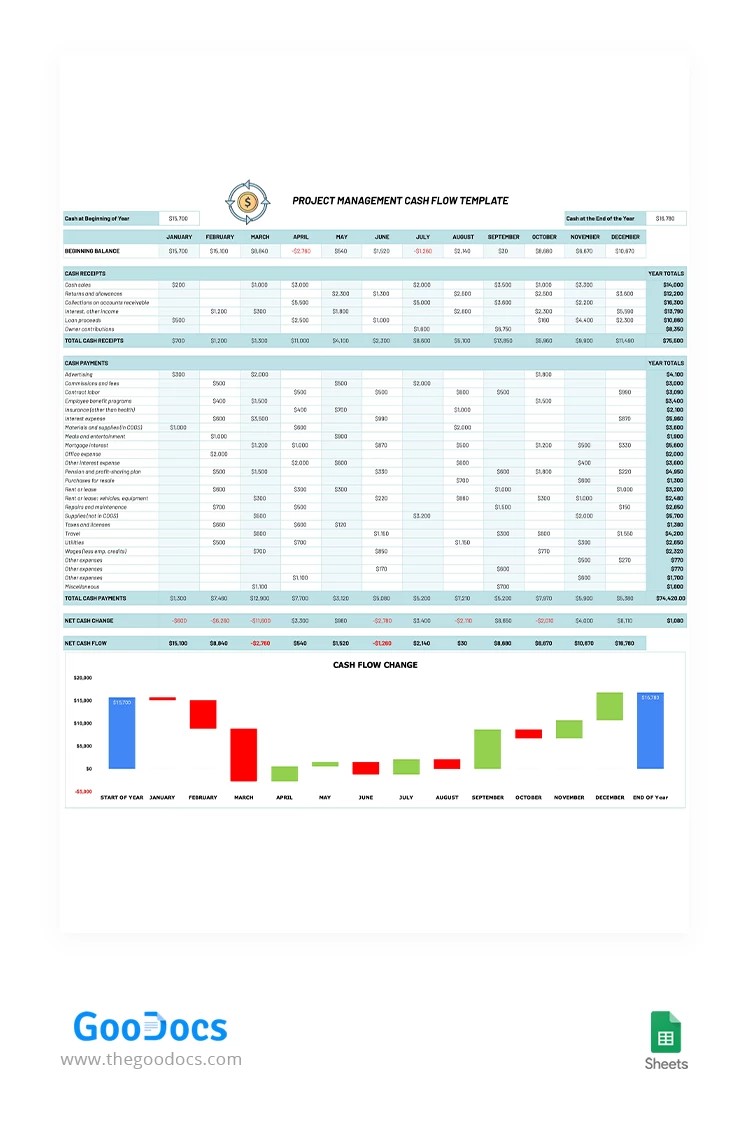
Counting a big stake of money is not an easy job, especially when it comes to a company’s budget or investment cash flow. But, there is always a way to ease the job! This project management cash flow template is a powerful tool to visualize the money flow and changes occurring during the project implementation. Welcome to save it from our website!
Campaign Budget
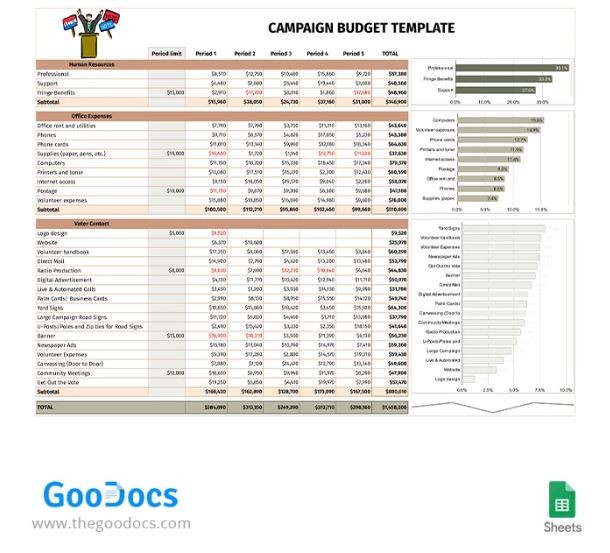
Can’t find a clear and concise campaign budget template for your business? Then here it is! This template provides a structured and comprehensive approach to budgeting, enabling you to accurately track the revenue and assess the overall financial health. The built-in chart will help visualize the net income and any other financial side. It is easy to use and eye-pleasant.
Easy Monthly Budget
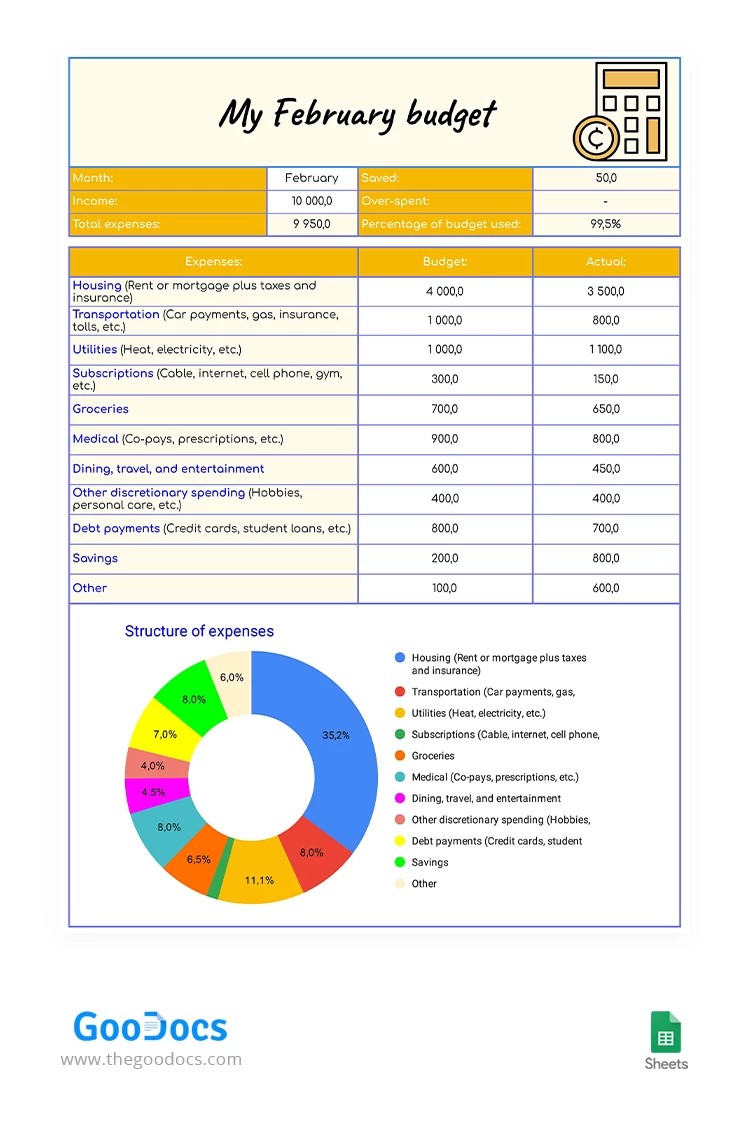
OMG! This personal monthly budget is what everyone can only dream about! It’s not easy to allocate our money resources with so many expenses, yet, if we use a visual tracker, we may see and divide our expenditures wisely. The template includes a round colorful chart that also gives a certain budget “charm”!
Free Budget Template With Charts
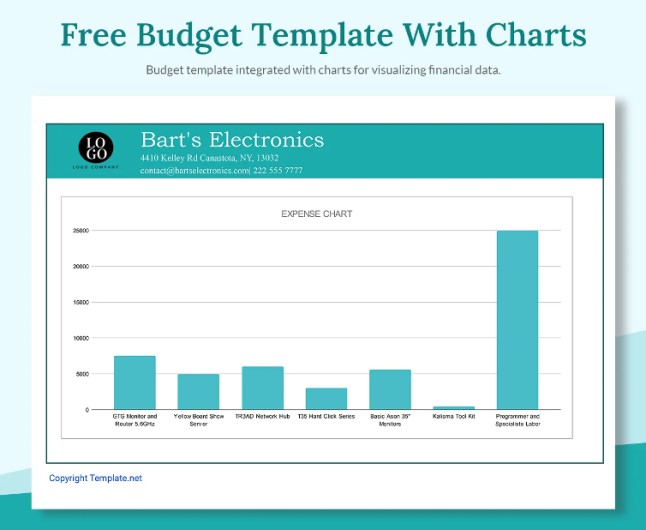
This free editable budget template will help you track expenses, revenues, and profits over a defined period of time. With the help of charts and graphs, you can quickly grasp the bigger picture of your business’s financial situation. Save it to Google Drive from any device and edit it whenever you are.
Have you liked this collection? We hope you can find a template to suit your project or budgeting mission! 🎉
You are welcome to save as many templates as you need and share them with your collaborators, colleagues, and friends!
Have a nice day! Stay effective!

We are a team of creative people who dream of sharing knowledge and making your work and study easier. Our team of professional designers prepares unique free templates. We create handy template descriptions for you to help you choose the most suitable one. On our blog, you'll find step-by-step tutorials on how to use Google Products. And our YouTube channel will show you all the ins and outs of Google products with examples.


